
Those of you looking to purchase solar systems for your properties are bound to be wrestling with solar panel energy production estimates.
Calculating the energy your future panels will produce is vital to owning a solar array. By doing so, you’ll be able to evaluate the feasibility and profitability of your solar system.
In this article, we walk you through the concept of solar panel energy production and discuss its importance.
Additionally, we demonstrate how to calculate your potential energy production and maximize it by harnessing 6 key variables.
Finally, we’ve summarized the average monthly solar panel energy production — using multiple panel wattages — in 6 U.S. states to assist you further.
Table of Contents
What Is Solar Panel Energy Production?
Solar panel energy production involves the amount of usable electrical energy, rated in kilowatt-hours (kWh) or watt-hours (Wh), that a solar panel produces daily.
To obtain this figure, you must multiply the power output in watts (W) or kilowatts (kW) by the usage time.
For example, if a solar panel has a power output of 100W over a 2 period, its energy production is as follows:
100Wx2h = 200W.h.
This is equivalent to 200W over 1 hour:
200Wx1h=200W.h
or 2000W for 6 minutes (0.1h):
2000Wx0.1h= 200W.h
In domestic terms, energy (in kWh) is essential. Your utility company calculates the price of electricity per kWh ($0.16/kWh on average in the U.S.).
Related Reading: kW vs. kWh
How To Work Out Solar Panel Energy Production
Estimating solar panel energy production is the preliminary step to designing a solar system.
First, let’s look at a rough estimation method that only uses the number of Peak Sun Hours (PSH). Following this, we’ll look at the solar energy prediction models online.
Solar Panel Energy Production: First Estimation
Generally, you’d use Peak Sun Hours (PSH) to estimate the solar panel energy production at a given location.
A PSH is defined as one hour of full sun power (1000W/m2) where a solar panel’s power output is at its maximum.
For example, a 100W solar panel under 3 PSH will continuously supply 100 watts for 3 hours. That’s an energy production of 300 W.h or 0.3 kWh.
Please note: Peak Sun Hour is a generic term; it’s also referred to as Global Horizontal Irradiance (GHI) in kWh/m2.
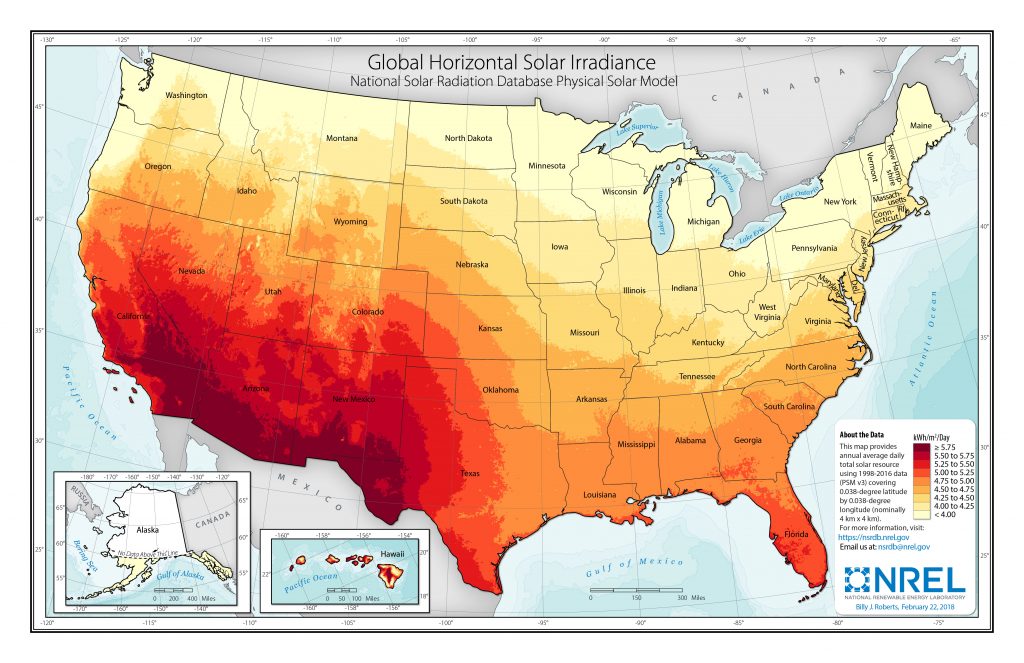
Source: NREL
Determining Average PSH
To determine the average number of PSH at your location, use a solar map such as the one below:
Then, multiply the number of PSH by your solar panel’s power output, giving you the average energy production.
For example, California has 5.5 PSH. Therefore, a 1000-watt (1kW) solar system will produce the following:
5.5hx1kW=5.5kWh per day.
The above figure is a reasonable estimation of solar panel energy production. However, there are several more factors that influence a solar panel’s energy production.
Let’s see what variables other prediction models take into account.
Solar Energy Production: Accurate Prediction Models
At Climatebiz, we recommend using the latest prediction tools based on satellite data collection and meteorological reports. These tools require your location as a starting input.
From our research, we found the most precise tools (aside from our solar calculator) to be:
Global Solar Atlas developed by Solargis for World Bank Group
PVWatts Calculator from NREL (National Renewable Energy Laboratory).
Global Solar Atlas combines three calculation models that take into account:
- Solar irradiation
- Temperature effect
- PV system loss
After entering your location, you’ll find various outputs, the most relevant being the PVOUT (specific photovoltaic power output) in kWh/kWp. This expresses the solar energy produced (kWh) for each kilowatt worth of solar panel installed on your roof(kWp).
Example: California
For example, California has an average PVOUT of 4.9 kWh/kWp, which translates into 1 kW (1000W) of installed solar panels producing 4.9 kWh daily.
To establish a solar system’s potential energy production, multiply location PVOUT by the system’s rated power.
A 5kW system in California has the following daily energy production:
4.9kWh/kWp x 5kW = 24.5kWh.
What Factors Influence The Amount Of Energy A Solar Panel Produces?
The following 6 factors influence the amount of energy a solar panel produces:
- Solar irradiation at the location
- Type of solar panel
- Tilt of the system
- System orientation
- Outside temperature
- System conversion
1. Solar Irradiation At The Location
Your location matters a lot!
Solar panels are variable power generators relying on sunlight to produce electricity. However, our sun is an intermittent source of energy — its intensity varies over the day and throughout the year.
What’s more, the sun doesn’t shine with the same intensity across the planet — a solar panel in Arizona produces two times more energy than the same system in Chicago!
2. Type Of Solar Panel
There are three major types of solar panels: monocrystalline, polycrystalline, and thin-film. We recommend monocrystalline solar panels — they are more efficient and offer a better tolerance to higher temperatures.
3. Tilt Of The System
A solar panel’s tilt is defined as its angle toward the horizon (vertical angle). The goal is to get maximum exposure to the sun.
The optimal tilt angle varies with latitude; the closer you get to the equator line, the flatter the angle.
In the US, the optimal tilt angle is, on average, 36°.
4. System Orientation
Finding the right direction for your solar panels maximizes their energy production.
In our recent article discussing solar panel direction, we demonstrated that solar panels in the northern hemisphere should face south, whereas panels in the southern hemisphere should face north.
5. Outside Temperature
A solar panel’s performance is greatly influenced by temperature — the hotter it gets, the lower the power output.
You’ll find a panel’s temperature coefficient in its specifications. This stat reflects the loss in power output for every increase in °C. Its value varies between -0.3%/°C and -0.5%/°C depending on the type of solar panel.
A panel under full sun exposure can get as hot as 60°C, and the power output can decrease by 15% from its rated value.
6. System Conversion
Solar panels are always coupled with an inverter that converts DC electricity into AC. This conversion step induces extra energy loss as the efficiency of inverters varies between 85% and 95%.
Solar Panel Energy Production Per State
Using data from Global Solar Atlas and NREL PVWatts, we created 4 tables outlining the average monthly kWh production of a 100-watt, 200-watt, 400-watt, and 5kW solar system in the following U.S. states:
- California
- Texas
- New York
- Massachusetts
- Washington
- North Carolina
We discovered that solar panels installed in California produce the most energy —around 30% more than in New York.
In addition, seasonal production variations are significant, with almost two times more energy produced during summer vs. winter.
Production Of A 100-Watt Solar Panel In kWh
| California | Texas | New York | Massachusetts | Washington | North Carolina | |
|---|---|---|---|---|---|---|
| January | 9.6 | 11.8 | 8.4 | 8.7 | 5 | 10.6 |
| February | 10.2 | 11.1 | 9.3 | 9.6 | 8.2 | 10.4 |
| March | 13.5 | 13.3 | 12.1 | 12.6 | 11.9 | 13.1 |
| April | 15 | 13.4 | 12.3 | 12.7 | 13.9 | 13.7 |
| May | 17 | 13.4 | 13.2 | 13.2 | 15.2 | 14.2 |
| June | 17.4 | 13.9 | 13 | 13 | 15.6 | 13.6 |
| July | 16.7 | 14.5 | 13.5 | 13.9 | 17.7 | 13.7 |
| August | 17.6 | 14.7 | 12.8 | 13.4 | 16.5 | 13.2 |
| September | 16.8 | 13.3 | 11.4 | 12 | 13.7 | 12.2 |
| October | 15.7 | 12.9 | 9.8 | 9.8 | 10.8 | 12.1 |
| November | 12.3 | 11.3 | 8.4 | 8.2 | 6.1 | 10.8 |
| December | 9.8 | 10.9 | 7.4 | 7.1 | 3.7 | 9.6 |
| Total | 171.6 kWh | 154.5 kWh | 131.6 kWh | 134.2 kWh | 138.3 kWh | 147.2 kWh |
Production Of A 200-Watt Solar Panel In kWh
| California | Texas | New York | Massachusetts | Washington | North Carolina | |
|---|---|---|---|---|---|---|
| January | 19.2 | 23.6 | 16.8 | 17.4 | 10 | 21.2 |
| February | 20.4 | 22.2 | 18.6 | 19.2 | 16.4 | 20.8 |
| March | 27 | 26.6 | 24.2 | 25.2 | 23.8 | 26.2 |
| April | 30 | 26.8 | 24.6 | 25.4 | 27.8 | 27.4 |
| May | 34 | 26.8 | 26.4 | 26.4 | 30.4 | 28.4 |
| June | 34.8 | 27.8 | 26 | 26 | 31.2 | 27.2 |
| July | 33.4 | 29 | 27 | 27.8 | 35.4 | 27.4 |
| August | 35.2 | 29.4 | 25.6 | 26.8 | 33 | 26.4 |
| September | 33.6 | 26.6 | 22.8 | 24 | 27.4 | 24.4 |
| October | 31.4 | 25.8 | 19.6 | 19.6 | 21.6 | 24.2 |
| November | 24.6 | 22.6 | 16.8 | 16.4 | 12.2 | 21.6 |
| December | 19.6 | 21.8 | 14.8 | 14.2 | 7.4 | 19.2 |
| Total | 343.2 kWh | 309 kWh | 263.2 kWh | 268.4 kWh | 276.6 kWh | 294.4 kWh |
Production Of A 400-Watt Solar Panel In kWh
| California | Texas | New York | Massachusetts | Washington | North Carolina | |
|---|---|---|---|---|---|---|
| January | 38.4 | 47.2 | 33.6 | 34.8 | 20 | 42.4 |
| February | 40.8 | 44.4 | 37.2 | 38.4 | 32.8 | 41.6 |
| March | 54 | 53.2 | 48.4 | 50.4 | 47.6 | 52.4 |
| April | 60 | 53.6 | 49.2 | 50.8 | 55.6 | 54.8 |
| May | 68 | 53.6 | 52.8 | 52.8 | 60.8 | 56.8 |
| June | 69.6 | 55.6 | 52 | 52 | 62.4 | 54.4 |
| July | 66.8 | 58 | 54 | 55.6 | 70.8 | 54.8 |
| August | 70.4 | 58.8 | 51.2 | 53.6 | 66 | 52.8 |
| September | 67.2 | 53.2 | 45.6 | 48 | 54.8 | 48.8 |
| October | 62.8 | 51.6 | 39.2 | 39.2 | 43.2 | 48.4 |
| November | 49.2 | 45.2 | 33.6 | 32.8 | 24.4 | 43.2 |
| December | 39.2 | 43.6 | 29.6 | 28.4 | 14.8 | 38.4 |
| Total | 686.4 kWh | 618 kWh | 526.4 kWh | 536.8 kWh | 553.2 kWh | 588.8 kWh |
Production Of A 5kW Solar System In kWh
| California | Texas | New York | Massachusetts | Washington | North Carolina | |
|---|---|---|---|---|---|---|
| January | 480 | 590 | 420 | 435 | 250 | 530 |
| February | 510 | 555 | 465 | 480 | 410 | 520 |
| March | 675 | 665 | 605 | 630 | 595 | 655 |
| April | 750 | 670 | 615 | 635 | 695 | 685 |
| May | 850 | 670 | 660 | 660 | 760 | 710 |
| June | 870 | 695 | 650 | 650 | 780 | 680 |
| July | 835 | 725 | 675 | 695 | 885 | 685 |
| August | 880 | 735 | 640 | 670 | 825 | 660 |
| September | 840 | 665 | 570 | 600 | 685 | 610 |
| October | 785 | 645 | 490 | 490 | 540 | 605 |
| November | 615 | 565 | 420 | 410 | 305 | 540 |
| December | 490 | 545 | 370 | 355 | 185 | 480 |
| Total | 8580 kWh | 7725 kWh | 6580 kWh | 6710 kWh | 6915 kWh | 7360 |
Final Thoughts
Every solar installation project starts with estimating the solar panel energy production in kWh.
Thanks to solar simulators like Solar Global Atlas, you can access accurate and professional energy assessments by only entering your location.
For a solar panel, energy production matters more than total power output.
Indeed, in a solar system, energy production and supply are separated. Solar panels produce energy, and the inverter supplies power to the connected load or the grid.
Through our research, we identified 6 factors that influence solar panels’ energy production — study each of them carefully to maximize your system’s performance.
As a final tip, we recommend installing a tracking device. Studies show that you could increase your PV energy production by 25 to 40%!