
When planning your first solar energy setup, the first question you may ask yourself is, “how much energy does one solar panel produce?”.
The answer to this question isn’t as straightforward as it may seem, but it is highly relevant.
Why? Because you need to know how much energy your solar panel (or array) produces to properly size your solar panel/array according to your energy needs.
What’s more, you’ll need to consider this information when sizing the rest of your solar energy system — your charge controller, solar battery, inverter, etc.
In this article, we show you how much energy a solar panel produces based on its rated wattage and location. Additionally, we take you through each estimation step, providing some working examples.
Table of Contents
What Determines Solar Panel Energy Production?
A solar panel is a device that converts sunlight into electricity. The amount of energy produced by a solar panel depends on several factors, including:
- location
- solar panel power output
- type of solar panel (monocrystalline, polycrystalline, thin-film)
- peak sun hours
- tilt/angle (relative to the ground/roof)
- solar panel efficiency
- ambient conditions (temperature, humidity, etc.)
- solar irradiance
- shading
As you can see, the amount of energy a solar panel produces depends on multiple variables.
But don’t worry! To roughly estimate how much energy one solar panel produces, you need to focus on two main factors:
- solar panel power output
- peak sun hours
Solar Panel Power Output
Solar panel power output expresses the maximum power the panel can generate under ideal conditions.
It is usually tested under Standard Test Conditions (STC), which include s solar irradiance level of 1,000 W/m2, cell temperature of 25° C (77° F), and air mass of 1.5.
Therefore, a 150W solar panel would provide 150W power under ideal conditions.
And because power is the energy transferred per unit of time, we have:
Energy (Wh) = Power (W) x Time (h)
With this, we can say that a 150W solar panel would generate 150 Wh of energy per peak sun hour (under ideal conditions):
Energy (Wh) = 150W x 1 hour of sun = 150 Wh
Peak Sun Hours (PSH)
It’s no surprise that some locations receive more sunlight than others. This is reflected by the number of peak sun hours for each location.
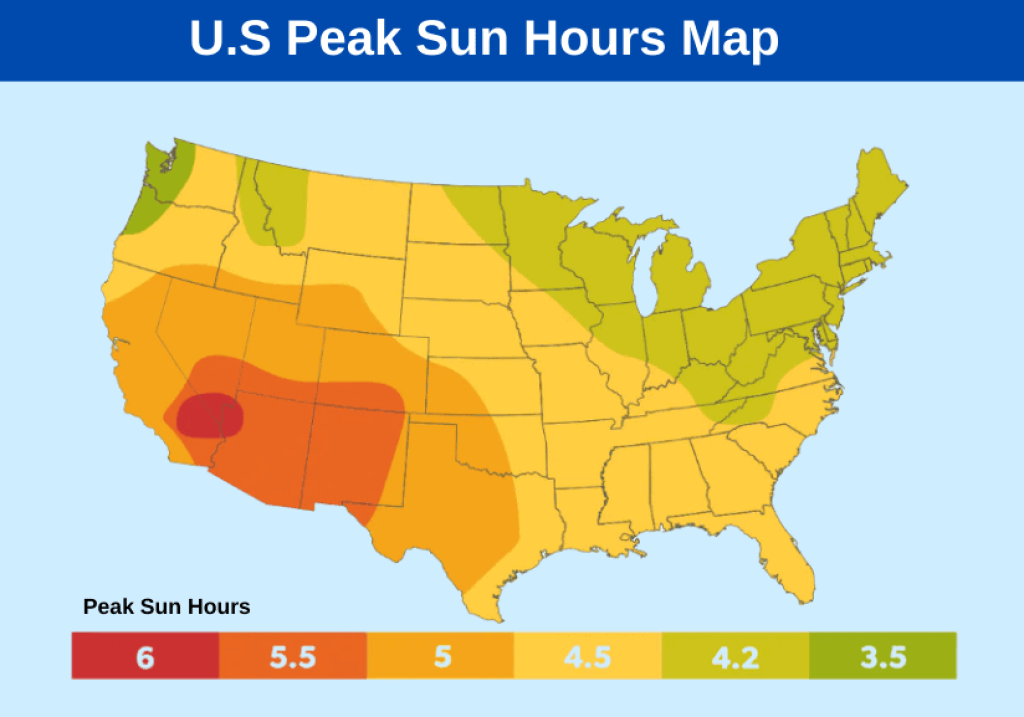
Peak sun hour is one hour of full sun power (1000 W/m2), in which a solar panel’s power output is at its maximum.
How To Estimate Solar Panel Energy Production?
Here are three ways to estimate solar panel energy production:
1. Using Peak Sun Hours (PSH) Data
An easy way to estimate how much energy one solar panel produce is to consider the panel’s rated power output and the location’s peak sun hours.
Example
Consider a 200W solar panel in Arizona (5.7 peak sun hours). Under ideal conditions, this panel should produce 200 Wh of energy per hour of sun. So in 5.7 hours of sun, it would produce:
Daily Energy Production (Wh) = Solar Panel Wattage (W) x Peak Sun Hours (h)
Daily Energy Production (Wh) = 200 W x 5.7 h = 1140 Wh = 1.14 kWh
However, this result is only valid under ideal conditions, which include peak sunshine, zero cloud cover, a low air temperature to prevent overheating, and a panel position that directly faces the sun.
Needless to say, these conditions are not a good reflection of “real world” conditions.
For this reason, when we estimate solar panel energy production using only the solar panel’s rated power output and peak sun hours info (based on location), we should multiply the final result by 80% to account for the impact of “real-world” conditions, like so:
Daily Energy Production (Wh) = Solar Panel Wattage (W) x Peak Sun Hours (h) x 80%
Therefore, the average daily solar panel energy production of a 200 W solar panel in Arizona is:
Daily Energy Production (Wh) = 1140 Wh x 0.8 = 912 Wh ≈ 0.9 kWh
2. Using PV Watts
PV Watts is an online photovoltaic energy production calculator developed by researchers at NREL (National Renewable Energy Laboratory). This tool helps you estimate the energy production of grid-connected photovoltaic (PV) energy systems worldwide.
To use this online calculator, fill in the required information (address/location, tilt, PV module type, etc.) to get started.
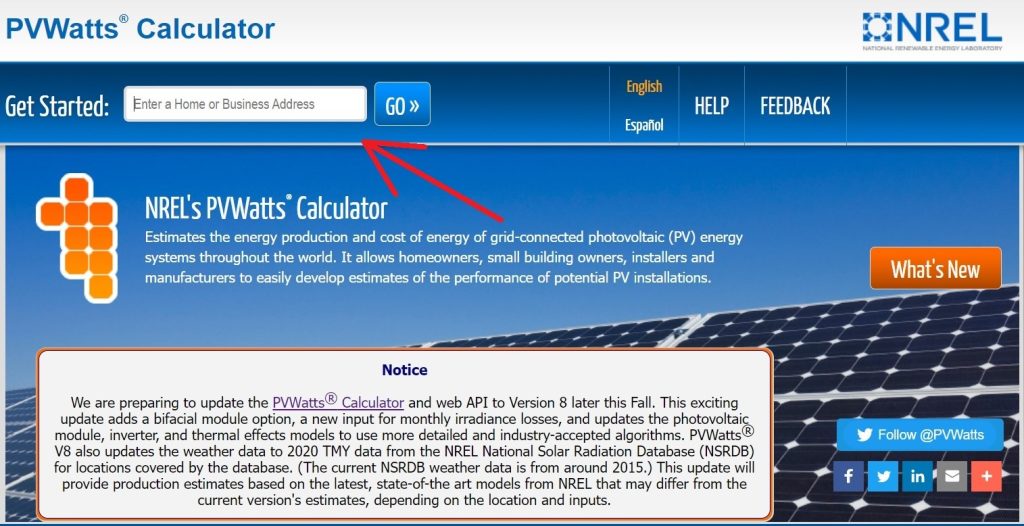
Source: pvwatts.nrel.gov
The online calculator will provide detailed results regarding solar radiation and energy production, both monthly and yearly.

Source: pvwatts.nrel.gov
3. Using Specific Photovoltaic Power Output (PVOUT)
Another interesting online tool is the Global Solar Atlas. This tool provides quick and easy global access to solar resources and photovoltaic power potential data.
The most important data this tool provides is the “specific photovoltaic power output” of the location, expressed in kWh/kWp. This metric provides the amount of energy (in kWh) produced for every kilowatt-peak (kWp) of module capacity over a day (or year).
Using this information, you can make more precise estimations since it considers empirical measurements and satellite data collection.
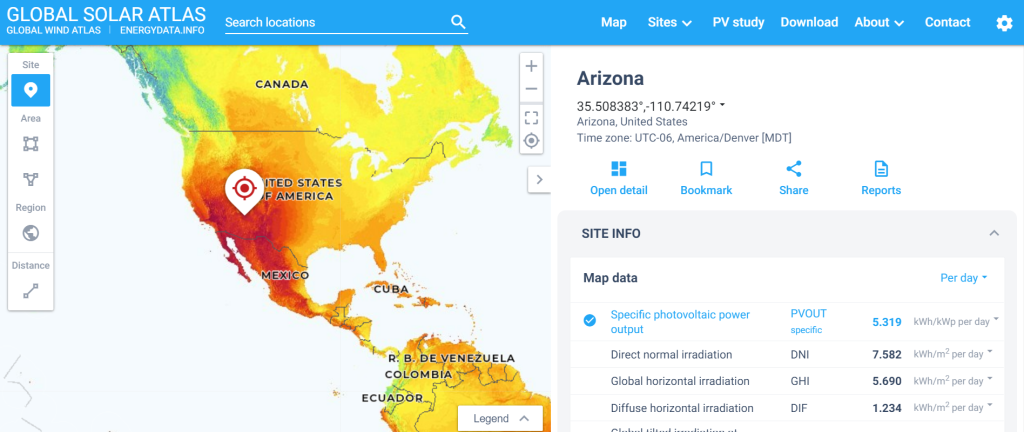
Source: globalsolaratlas.info
With this information at hand, you need to use the following formula to estimate solar panel energy production:
Energy Production Per Day = PVOUT (kWh / kWp) x Solar Panel Power Rating (kW)
Example
For a 200W solar panel at a location with a PVOUT of 5.3 kWh/kWp per day, the solar panel energy production is:
Energy Production Per Day = 5.3 kWh / kWp x 0.2 kW = 1.06 kWh
How Much Energy Does One 100-Watt Solar Panel Produce?
On average, a 100W solar panel produces 0.4 kWh per day and 148 kWh per year. However, these numbers can vary significantly depending on your location.
Below, we prepared a table with the average energy produced by a 100W solar panel in different U.S. states, daily and annually.
| U.S. State | PVOUT Average Per Day (kWh/kWp) | 100W Solar Panel Average Energy Production Per Day | 100W Solar Panel Average Energy Production Per Year |
|---|---|---|---|
| Alabama | 4 | 0.4 kWh | 146 kWh |
| Arizona | 4.9 | 0.49 kWh | 178.9 kWh |
| Arkansas | 4.1 | 0.41 kWh | 149.7 kWh |
| California | 4.8 | 0.48 kWh | 175.2 kWh |
| Colorado | 4.4 | 0.44 kWh | 160.6 kWh |
| Connecticut | 3.4 | 0.34 kWh | 124.1 kWh |
| Florida | 4 | 0.4 kWh | 146 kWh |
| Georgia | 4 | 0.4 kWh | 146 kWh |
| Hawaii | 3.6 | 0.36 kWh | 131.4 kWh |
| Idaho | 4.4 | 0.44 kWh | 160.6 kWh |
| Illinois | 3.9 | 0.39 kWh | 142.4 kWh |
| Indiana | 3.8 | 0.38 kWh | 138.7 kWh |
| Iowa | 4 | 0.4 kWh | 146 kWh |
| Kansas | 4.5 | 0.45 kWh | 164.3 kWh |
| Kentucky | 3.9 | 0.39 kWh | 142.4 kWh |
| Louisiana | 4.1 | 0.41 kWh | 149.7 kWh |
| Maine | 3.6 | 0.36 kWh | 131.4 kWh |
| Maryland | 3.9 | 0.39 kWh | 142.4 kWh |
| Massachusetts | 3.8 | 0.38 kWh | 138.7 kWh |
| Michigan | 3.6 | 0.36 kWh | 131.4 kWh |
| Minnesota | 3.9 | 0.39 kWh | 142.4 kWh |
| Mississippi | 4.1 | 0.41 kWh | 149.7 kWh |
| Missouri | 4 | 0.4 kWh | 146 kWh |
| Montana | 4 | 0.4 kWh | 146 kWh |
| Nebraska | 4.4 | 0.44 kWh | 160.6 kWh |
| Nevada | 4.9 | 0.49 kWh | 178.9 kWh |
| New Hampshire | 3.7 | 0.37 kWh | 135.1 kWh |
| New Jersey | 3.9 | 0.39 kWh | 142.4 kWh |
| New Mexico | 5.2 | 0.52 kWh | 189.8 kWh |
| New York | 3.4 | 0.34 kWh | 124.1 kWh |
| North Carolina | 4.2 | 0.42 kWh | 153.3 kWh |
| North Dakota | 4.2 | 0.42 kWh | 153.3 kWh |
| Ohio | 3.7 | 0.37 kWh | 135.1 kWh |
| Oklahoma | 4.4 | 0.44 kWh | 160.6 kWh |
| Oregon | 4.3 | 0.43 kWh | 157 kWh |
| Pennsylvania | 3.5 | 0.35 kWh | 127.8 kWh |
| Rhode Island | 3.9 | 0.39 kWh | 142.4 kWh |
| South Carolina | 4.3 | 0.43 kWh | 157 kWh |
| South Dakota | 4.2 | 0.42 kWh | 153.3 kWh |
| Tennessee | 3.9 | 0.39 kWh | 142.4 kWh |
| Texas | 4.4 | 0.44 kWh | 160.6 kWh |
| Utah | 4.6 | 0.46 kWh | 167.9 kWh |
| Vermont | 3.4 | 0.34 kWh | 124.1 kWh |
| Virginia | 4.1 | 0.41 kWh | 149.7 kWh |
| Washington | 3.3 | 0.33 kWh | 120.5 kWh |
| West Virginia | 3.6 | 0.36 kWh | 131.4 kWh |
| Wisconsin | 3.8 | 0.38 kWh | 138.7 kWh |
| Wyoming | 4.6 | 0.46 kWh | 167.9 kWh |
How Much Energy Does One 200-Watt Solar Panel Produce?
On average, a 200W solar panel produces 0.81 kWh per day and 296 kWh per year. However, these numbers can vary considerably depending on your location.
Below, we prepared a table with the average energy produced by a 200W solar panel in different U.S. states, daily and annually.
| U.S. State | PVOUT Average Per Day (kWh/kWp) | 200W Solar Panel Average Energy Production Per Day | 200W Solar Panel Average Energy Production Per Year |
|---|---|---|---|
| Alabama | 4 | 0.8 kWh | 292 kWh |
| Arizona | 4.9 | 0.98 kWh | 357.7 kWh |
| Arkansas | 4.1 | 0.82 kWh | 299.3 kWh |
| California | 4.8 | 0.96 kWh | 350.4 kWh |
| Colorado | 4.4 | 0.88 kWh | 321.2 kWh |
| Connecticut | 3.4 | 0.68 kWh | 248.2 kWh |
| Florida | 4 | 0.8 kWh | 292 kWh |
| Georgia | 4 | 0.8 kWh | 292 kWh |
| Hawaii | 3.6 | 0.72 kWh | 262.8 kWh |
| Idaho | 4.4 | 0.88 kWh | 321.2 kWh |
| Illinois | 3.9 | 0.78 kWh | 284.7 kWh |
| Indiana | 3.8 | 0.76 kWh | 277.4 kWh |
| Iowa | 4 | 0.8 kWh | 292 kWh |
| Kansas | 4.5 | 0.9 kWh | 328.5 kWh |
| Kentucky | 3.9 | 0.78 kWh | 284.7 kWh |
| Louisiana | 4.1 | 0.82 kWh | 299.3 kWh |
| Maine | 3.6 | 0.72 kWh | 262.8 kWh |
| Maryland | 3.9 | 0.78 kWh | 284.7 kWh |
| Massachusetts | 3.8 | 0.76 kWh | 277.4 kWh |
| Michigan | 3.6 | 0.72 kWh | 262.8 kWh |
| Minnesota | 3.9 | 0.78 kWh | 284.7 kWh |
| Mississippi | 4.1 | 0.82 kWh | 299.3 kWh |
| Missouri | 4 | 0.8 kWh | 292 kWh |
| Montana | 4 | 0.8 kWh | 292 kWh |
| Nebraska | 4.4 | 0.88 kWh | 321.2 kWh |
| Nevada | 4.9 | 0.98 kWh | 357.7 kWh |
| New Hampshire | 3.7 | 0.74 kWh | 270.1 kWh |
| New Jersey | 3.9 | 0.78 kWh | 284.7 kWh |
| New Mexico | 5.2 | 1.04 kWh | 379.6 kWh |
| New York | 3.4 | 0.68 kWh | 248.2 kWh |
| North Carolina | 4.2 | 0.84 kWh | 306.6 kWh |
| North Dakota | 4.2 | 0.84 kWh | 306.6 kWh |
| Ohio | 3.7 | 0.74 kWh | 270.1 kWh |
| Oklahoma | 4.4 | 0.88 kWh | 321.2 kWh |
| Oregon | 4.3 | 0.86 kWh | 313.9 kWh |
| Pennsylvania | 3.5 | 0.7 kWh | 255.5 kWh |
| Rhode Island | 3.9 | 0.78 kWh | 284.7 kWh |
| South Carolina | 4.3 | 0.86 kWh | 313.9 kWh |
| South Dakota | 4.2 | 0.84 kWh | 255.5 kWh |
| Tennessee | 3.9 | 0.78 kWh | 284.7 kWh |
| Texas | 4.4 | 0.88 kWh | 321.2 kWh |
| Utah | 4.6 | 0.92 kWh | 335.8 kWh |
| Vermont | 3.4 | 0.68 kWh | 248.2 kWh |
| Virginia | 4.1 | 0.82 kWh | 299.3 kWh |
| Washington | 3.3 | 0.66 kWh | 240.9 kWh |
| West Virginia | 3.6 | 0.72 kWh | 262.8 kWh |
| Wisconsin | 3.8 | 0.76 kWh | 277.4 kWh |
| Wyoming | 4.6 | 0.92 kWh | 335.8 kWh |
How Much Energy Does One 300-Watt Solar Panel Produce?
On average, a 300W solar panel produces 1.22 kWh per day and 444 kWh per year. However, these numbers can vary significantly depending on your location.
Below, we prepared a table with the average energy produced by a 300W solar panel in different U.S. states daily and annually.
| U.S. State | PVOUT Average Per Day (kWh/kWp) | 300 W Solar Panel Average Energy Production Per Day | 300 W Solar Panel Average Energy Production Per Year |
|---|---|---|---|
| Alabama | 4 | 1.2 kWh | 438 kWh |
| Arizona | 4.9 | 1.47 kWh | 536.6 kWh |
| Arkansas | 4.1 | 1.23 kWh | 449 kWh |
| California | 4.8 | 1.44 kWh | 525.6 kWh |
| Colorado | 4.4 | 1.32 kWh | 481.8 kWh |
| Connecticut | 3.4 | 1.02 kWh | 372.3 kWh |
| Florida | 4 | 1.2 kWh | 438 kWh |
| Georgia | 4 | 1.2 kWh | 438 kWh |
| Hawaii | 3.6 | 1.08 kWh | 394.2 kWh |
| Idaho | 4.4 | 1.32 kWh | 481.8 kWh |
| Illinois | 3.9 | 1.17 kWh | 427.1 kWh |
| Indiana | 3.8 | 1.14 kWh | 416.1 kWh |
| Iowa | 4 | 1.2 kWh | 438 kWh |
| Kansas | 4.5 | 1.35 kWh | 492.8 kWh |
| Kentucky | 3.9 | 1.17 kWh | 427.1 kWh |
| Louisiana | 4.1 | 1.23 kWh | 449 kWh |
| Maine | 3.6 | 1.08 kWh | 394.2 kWh |
| Maryland | 3.9 | 1.17 kWh | 427.1 kWh |
| Massachusetts | 3.8 | 1.14 kWh | 416.1 kWh |
| Michigan | 3.6 | 1.08 kWh | 394.2 kWh |
| Minnesota | 3.9 | 1.17 kWh | 427.1 kWh |
| Mississippi | 4.1 | 1.23 kWh | 449 kWh |
| Missouri | 4 | 1.2 kWh | 438 kWh |
| Montana | 4 | 1.2 kWh | 438 kWh |
| Nebraska | 4.4 | 1.32 kWh | 481.8 kWh |
| Nevada | 4.9 | 1.47 kWh | 536.6 kWh |
| New Hampshire | 3.7 | 1.11 kWh | 405.2 kWh |
| New Jersey | 3.9 | 1.17 kWh | 427.1 kWh |
| New Mexico | 5.2 | 1.56 kWh | 569.4 kWh |
| New York | 3.4 | 1.02 kWh | 372.3 kWh |
| North Carolina | 4.2 | 1.26 kWh | 459.9 kWh |
| North Dakota | 4.2 | 1.26 kWh | 459.9 kWh |
| Ohio | 3.7 | 1.11 kWh | 405.2 kWh |
| Oklahoma | 4.4 | 1.32 kWh | 481.8 kWh |
| Oregon | 4.3 | 1.29 kWh | 470.9 kWh |
| Pennsylvania | 3.5 | 1.05 kWh | 383.3 kWh |
| Rhode Island | 3.9 | 1.17 kWh | 427.1 kWh |
| South Carolina | 4.3 | 1.29 kWh | 470.9 kWh |
| South Dakota | 4.2 | 1.26 kWh | 459.9 kWh |
| Tennessee | 3.9 | 1.17 kWh | 427.1 kWh |
| Texas | 4.4 | 1.32 kWh | 481.8 kWh |
| Utah | 4.6 | 1.38 kWh | 503.7 kWh |
| Vermont | 3.4 | 1.02 kWh | 372.3 kWh |
| Virginia | 4.1 | 1.23 kWh | 449 kWh |
| Washington | 3.3 | 0.99 kWh | 361.4 kWh |
| West Virginia | 3.6 | 1.08 kWh | 394.2 kWh |
| Wisconsin | 3.8 | 1.14 kWh | 416.1 kWh |
| Wyoming | 4.6 | 1.38 kWh | 503.7 kWh |
How Much Energy Does One 400-Watt Solar Panel Produce?
On average, a 400W solar panel produces 1.62 kWh per day and 592 kWh per year. However, these numbers can vary considerably depending on your location.
Below, we prepared a table with the average energy produced by a 400W solar panel in different states of the U.S., both daily and annually.
| U.S. State | PVOUT Average Per Day (kWh/kWp) | 400W Solar Panel Average Energy Production Per Day | 400W Solar Panel Average Energy Production Per Year |
|---|---|---|---|
| Alabama | 4 | 1.6 kWh | 584 kWh |
| Arizona | 4.9 | 1.96 kWh | 715.4 kWh |
| Arkansas | 4.1 | 1.64 kWh | 598.6 kWh |
| California | 4.8 | 1.92 kWh | 700.8 kWh |
| Colorado | 4.4 | 1.76 kWh | 642.4 kWh |
| Connecticut | 3.4 | 1.36 kWh | 496.4 kWh |
| Florida | 4 | 1.6 kWh | 584 kWh |
| Georgia | 4 | 1.6 kWh | 584 kWh |
| Hawaii | 3.6 | 1.44 kWh | 525.6 kWh |
| Idaho | 4.4 | 1.76 kWh | 642.4 kWh |
| Illinois | 3.9 | 1.56 kWh | 569.4 kWh |
| Indiana | 3.8 | 1.52 kWh | 554.8 kWh |
| Iowa | 4 | 1.6 kWh | 584 kWh |
| Kansas | 4.5 | 1.8 kWh | 657 kWh |
| Kentucky | 3.9 | 1.56 kWh | 569.4 kWh |
| Louisiana | 4.1 | 1.64 kWh | 598.6 kWh |
| Maine | 3.6 | 1.44 kWh | 525.6 kWh |
| Maryland | 3.9 | 1.56 kWh | 569.4 kWh |
| Massachusetts | 3.8 | 1.52 kWh | 554.8 kWh |
| Michigan | 3.6 | 1.44 kWh | 525.6 kWh |
| Minnesota | 3.9 | 1.56 kWh | 569.4 kWh |
| Mississippi | 4.1 | 1.64 kWh | 598.6 kWh |
| Missouri | 4 | 1.6 kWh | 584 kWh |
| Montana | 4 | 1.6 kWh | 584 kWh |
| Nebraska | 4.4 | 1.76 kWh | 642.4 kWh |
| Nevada | 4.9 | 1.96 kWh | 715.4 kWh |
| New Hampshire | 3.7 | 1.48 kWh | 540.2 kWh |
| New Jersey | 3.9 | 1.56 kWh | 569.4 kWh |
| New Mexico | 5.2 | 2.08 kWh | 759.2 kWh |
| New York | 3.4 | 1.36 kWh | 496.4 kWh |
| North Carolina | 4.2 | 1.68 kWh | 613.2 kWh |
| North Dakota | 4.2 | 1.68 kWh | 613.2 kWh |
| Ohio | 3.7 | 1.48 kWh | 540.2 kWh |
| Oklahoma | 4.4 | 1.76 kWh | 642.4 kWh |
| Oregon | 4.3 | 1.72 kWh | 627.8 kWh |
| Pennsylvania | 3.5 | 1.4 kWh | 511 kWh |
| Rhode Island | 3.9 | 1.56 kWh | 569.4 kWh |
| South Carolina | 4.3 | 1.72 kWh | 627.8 kWh |
| South Dakota | 4.2 | 1.68 kWh | 613.2 kWh |
| Tennessee | 3.9 | 1.56 kWh | 569.4 kWh |
| Texas | 4.4 | 1.76 kWh | 642.4 kWh |
| Utah | 4.6 | 1.84 kWh | 671.6 kWh |
| Vermont | 3.4 | 1.36 kWh | 496.4 kWh |
| Virginia | 4.1 | 1.64 kWh | 598.6 kWh |
| Washington | 3.3 | 1.32 kWh | 481.8 kWh |
| West Virginia | 3.6 | 1.44 kWh | 525.6 kWh |
| Wisconsin | 3.8 | 1.52 kWh | 554.8 kWh |
| Wyoming | 4.6 | 1.84 kWh | 671.6 kWh |
It’s important to point out that these numbers are only rough estimations calculated using the following:
Energy Production Per Day = PVOUT (kWh / kWp) x Solar Panel Power Rating (kW)
“Real-life” figures can differ significantly from the estimated numbers due to the many factors impacting solar panel energy production.
Final Thoughts
Solar panels are a great way to generate power. They give us the ability to harness clean and renewable energy.
As discussed in this article, the amount of energy produced by a solar panel depends on multiple variables, mainly the panel’s power output and the location/peak sun hours.
Therefore, accurately estimating solar panel energy production isn’t a simple task.
Luckily, nowadays, you can count on excellent online tools, such as PV Watts (online calculator developed by NREL) and Global Solar Atlas, which use solar irradiance data and photovoltaic power data to provide more accurate estimations of solar energy production.
We used PVOUT data from Global Solar Atlas to calculate how much energy a solar panel produces (of different wattages: 100W, 200W, 300W, and 400W) in each state of the U.S. and organized the results in tables to make things easier for you.
If you still have questions on this topic, don’t hesitate to reach out to us in the comment section below!