
For you to know how long it takes solar panels to pay for themselves, you need to understand the two most influential determining factors: total cost and total savings.
These principal price factors are highly influenced by several variables, as we will discuss later on.
You can expect your payback period to fall between 2.5 to 15 years, depending on where you live. Some states get more solar power than other areas. Solar tax credits can reduce your total solar cost by up to 26%. Utility rates also have a significant impact on your solar savings.
Table of Contents
Factors Affecting Solar Panel Costs
These are some of the other variables that also affect your return-on-investment rate:
Financing
Paying your solar installation in cash upfront avoids future interest payments from solar companies.
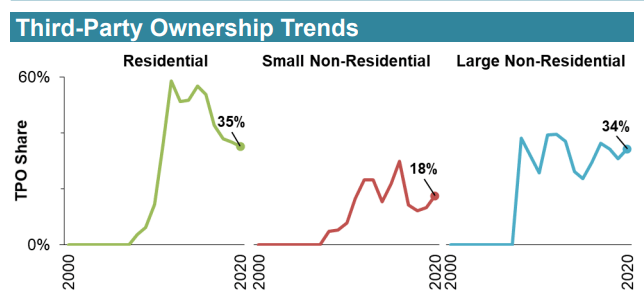
The best solar companies‘ long-term lease agreements look very attractive since they provide zero down payments and escalated rate options. However, it also ties you down to your home for 20-25 years which causes anxiety for people who move often.
A lot of people are beginning to realize this, which leads to lower solar system third-part ownership trends (see figure below)
Size Of Your Solar System
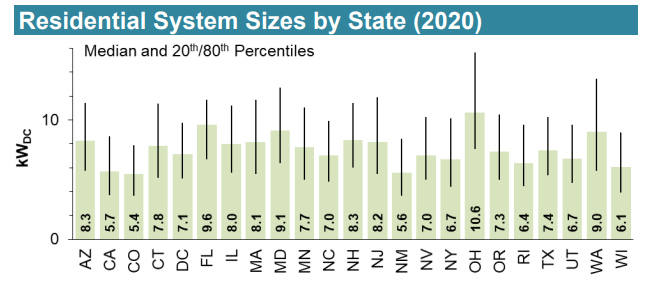
According to Berkeley Labs, larger solar panel systems, say 5kW, are cheaper in terms of $/watt than smaller system sizes.
State-Specific Factors
The cost of living in your state may also affect your cost of solar panel installation.
Soft Costs
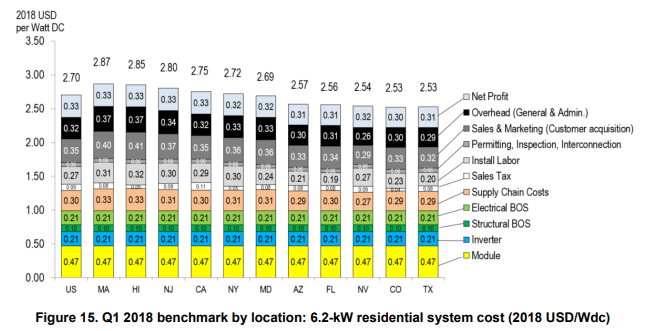
According to NREL, about 65% of the cost of solar installation in the United States is for soft fees, which cover labor, sales tax, customer acquisition costs, permitting, inspections, overhead, and profit.
The share of soft costs for solar panel installation may vary greatly depending on the policies and business model of your state and solar company, respectively.
Local Financial Incentives
Aside from solar tax credits, there are also varying incentives accessible to homeowners per state. These may be in the form of either federal or state incentives.
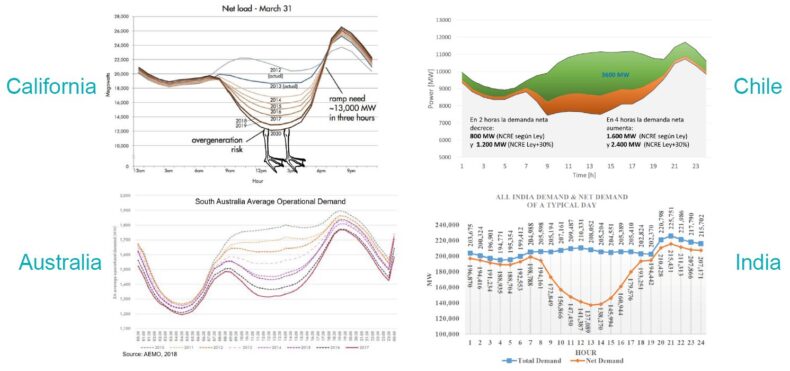
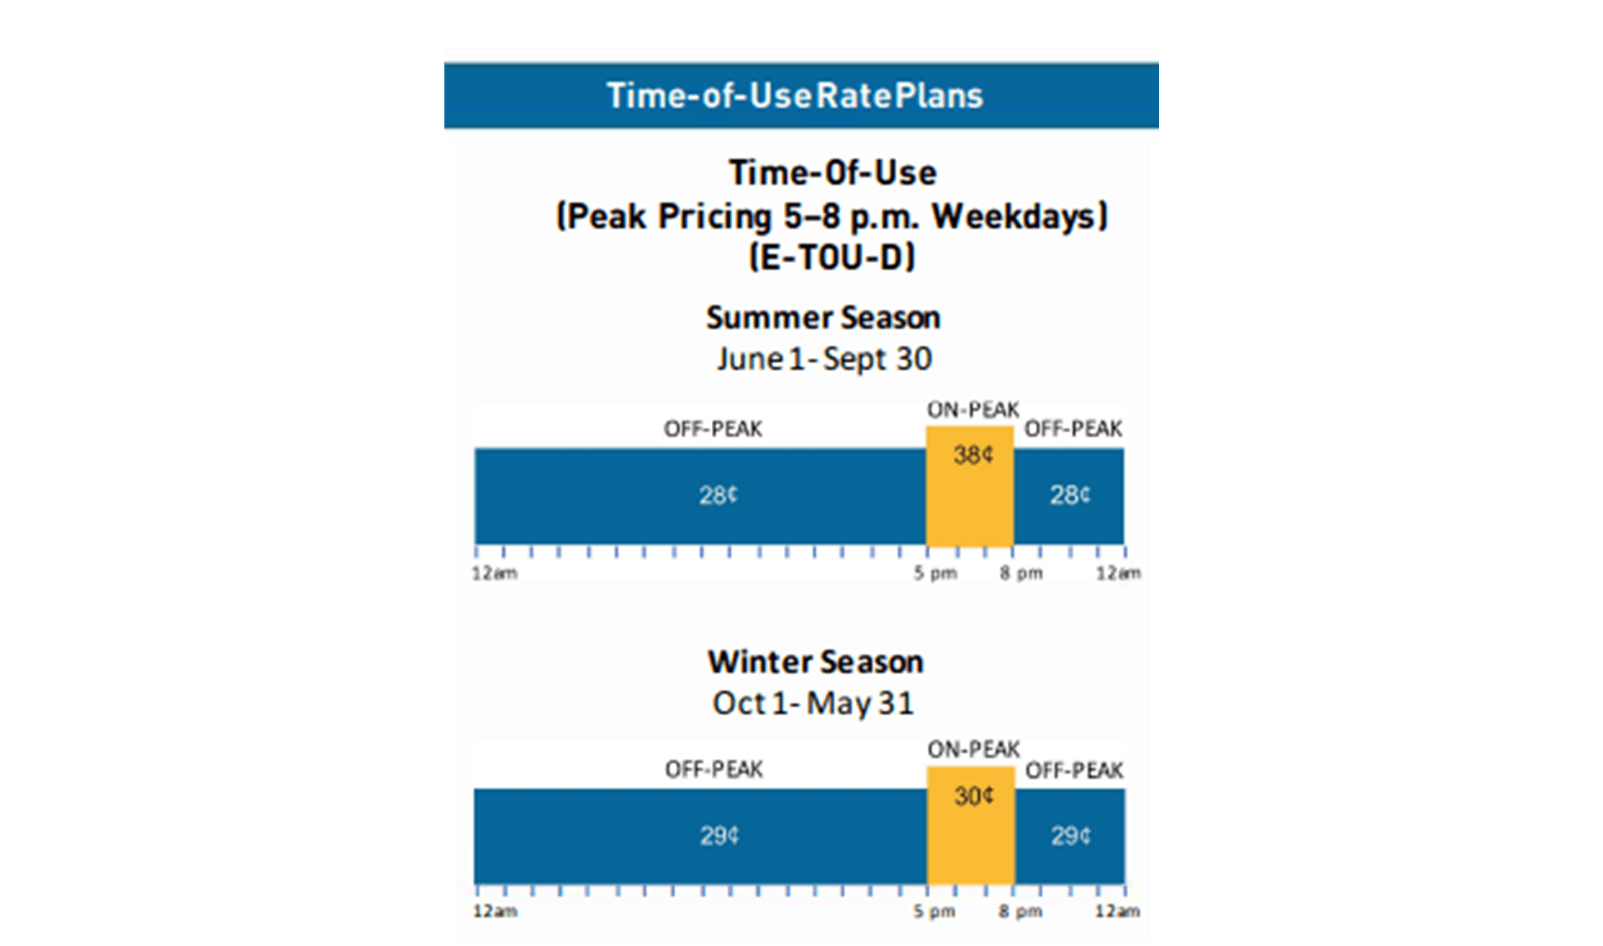
Utilities sometimes even give their customers alternative options to fixed electricity rates such as time-of-use (ToU) rates and tiered rates to address some problems caused by solar panels in the late afternoons.
How Long Does It Take Solar Panels To Pay For Themselves?
Now we’re going to help you determine how long it will take for your solar panels to pay for themselves.
Here at Climatebiz, we are committed to empowering our readers to do their due diligence regarding green energy ventures. We will share our solar payback period calculation process with you to plug your numbers into the equations.
Know Your Average Monthly Electricity Bill
The first step toward determining solar payback is figuring out the size of your solar system. To do that, you need to look at your average electricity usage, expressed in kWh, then design a solar system that makes enough energy to offset that usage over the year.
Knowing your average monthly electricity bill helps you with a lot of things. First, it is the quickest way to reduce your monthly bills by being a more informed consumer. Remember that ToU and other energy plan rates are structured to fit certain levels of usage.
Second, you can use your average monthly electricity bill to size your solar panel system by doing the following computation.
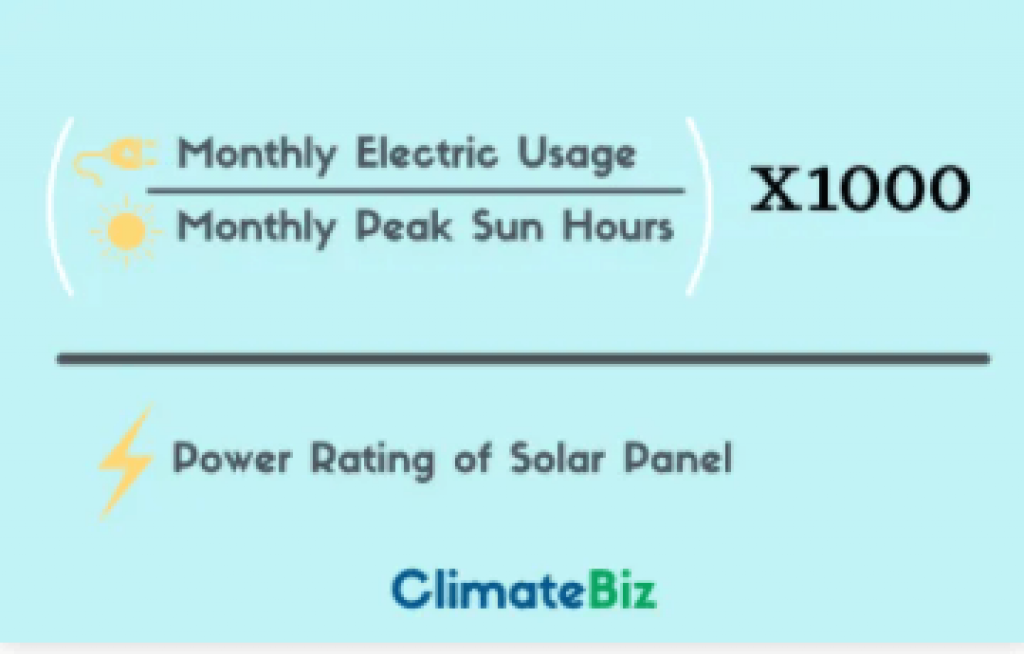
Assess Your Home’s Solar Potential
Next, we assess your home’s solar potential by getting the average monthly peak sun hours in your area.
Below are resources for the following countries:
Calculate Or Get A Quote For Your Overall Total System Cost
Talk with a solar installer near you to determine the gross upfront cost of your system. Note that this will depend on the size of the system and the type of equipment you need, and add-ons like solar battery storage.
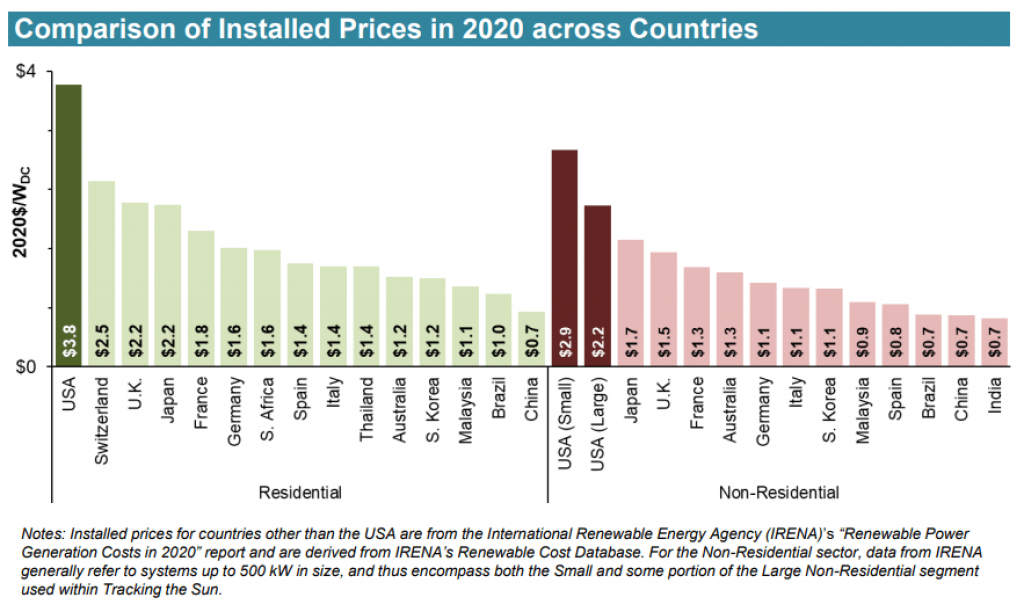
Please refer to the installed solar cost per country ($/watt) in the figure below. Then multiply it with your solar system size (kW) for a quick estimate. This will give you your total system cost ($) before incentives.
We understand that different organizations such as NREL, IRENA, and Berkeley Labs have varying figures. This is because the financial model of solar installation is sensitive to a lot of real-world factors.
Factor In Solar Incentives
Each government around the world has a variety of policies in place to encourage the adaptation of solar. The most common ones are feed-in-tariffs, tax credits, pricing laws, and production incentives, among others.
Taking advantage of these incentives can reduce the cost you pay for solar.
Calculate Payback Period
Divide the cost of the system (including financial incentives) by the annual amount you’ll save on electricity bills. This will tell you roughly how many years it will take for you to recoup your initial investment. Beyond that, every month that you run your solar system can be counted as financial gain.

Solar Panel Return On Investment In The United States
Now let’s put these concepts into action.
Let’s make an example residential home that uses 10,000 kilowatt-hours (kWh) of electricity per year. That’s 833.33 kWh monthly.
Peak sun hours in California average 5.2 hours daily. The monthly peak sun hours are equivalent to 5.2 x 30.5 = 158.6 hours. If you are wondering where the 30.5 came from, the average number of days in a month is 30.42.
Lastly, divide 833.33 kWh by 158.6, and you get a system size of about 5.25 kW. For simplicity’s sake, we will round the solar system size down to 5 kW, located in California.
According to NREL, the national average cost of a 5 kW home solar system is about $2.85 per watt, or $14,250, before incentives. Berkeley Labs, on the other hand, says that it is $3.8 per watt. This will amount to $19,000
Solar System cost
A 5kW solar system will be priced around $14,000 to $19,000. Factor in primary solar incentives, and you reduce the total solar system price by 26%. After incentives, your total solar system cost is $10,360 to $14,060.
Electricity Costs Saved
A 5kW solar system will produce about 8,233 kWh a year, according to PV Watts. The cost of electricity in California is approximately 22.45 cents per kWh. Multiplying 8,233 kWh by 22.45 cents per kWh amounts to $1850 saved annually.
Finally, divide the total solar system cost by the annual electricity savings to determine how long it will take for the solar panels to pay for themselves.
Payback period
In our example, $14,000 and $19,000 divided by $1850 per year are 7.5 to 10.5 years, respectively. This is the range of your payback period without solar tax credits. Using the total costs with solar tax credits, you will get a range between 5.6 to 7.5 years.
A word of caution: Solar federal tax credits decrease as the years pass. The solar credit you get is 26% of the installed cost for systems installed by 12/31/2022. It falls to 22% in 2025 and will be eliminated in 2025 for residential customers.
Solar Panel Return On Investment In The United Kingdom
Using the same process mentioned above, let’s determine the payback period of a solar system in the U.K., given their circumstances.
Average electricity consumption: 4200 kWh. This means that the average electricity usage per month in U.K. households is about 350kWh.
Peak Sun Hours: 2.5 hours daily x 30.5 = 76.25 hours monthly
- Solar System Size: 350 kWh divided by 76.25 hours = 4.72 kW, approximately 5 kW
Note: Going beyond your daily solar needs will qualify you for a Smart Export Guarantee contract with the government. This is optional.
Solar System Cost
5kW multiplied by 1.6 pounds sterling ($2.2 equivalent as of October 2021) = £8,000.
There are not many solar incentives available in the U.K. It is straightforward given that the price per watt is meager compared to the United States.
Electricity Cost Saved
According to PV Watts, a 5kW solar system will produce about 4,366 kWh a year. The electricity cost in the U.K. is 14.37 pence per kWh. Multiply 4,366 kWh per year by £0.1437 gives you £627.4 per year.
Payback Period
Eight thousand pounds sterling divided by 627.4 pounds sterling per year gives you a payback period of 12.75 years.
Solar Panel Return On Investment In Australia
Using the same process mentioned above, let’s determine the payback period of a solar system in Australia given their circumstances.
Average electricity consumption: 19kWh per day multiplied by 365 days is 6935 kWh. This means that the average electricity usage per month in Australian households is about 578 kWh.
Peak Sun Hours: 5 hours daily national average x 30.5 = 152.5 hours monthly
- Solar System Size: 578 kWh divided by 152.5 hours = 3.78 kW, approximately 4 kW
Solar System Cost
4kW multiplied by 1.6 AUD ($1.2 equivalent as of October 2021) = 6,400 AUD
Electricity Cost Saved
According to PV Watts, a 4kW solar system will produce about 7,063 kWh a year. The electricity cost in Australia is 34.41 cents per kilowatt-hour. Multiply 7,063 kWh per year by 0.3441 AUD gives you 2,430 AUD per year.
Payback Period
6,400 AUD divided by 2,430 AUD per year gives you a payback period of 2.6 years.
Solar Panel Return On Investment In Canada
Using the same process mentioned above, let’s determine the payback period of a solar system in Canada, given their circumstances.
Average electricity consumption: The average Canadian household uses 11,135 kWh of electricity per year. This means that the average electricity usage per month in Canadian homes is about 927.9 kWh.
Peak Sun Hours: About 4.2 hours daily average x 30.5 = 128.1 hours monthly
- Solar System Size: 927.9 kWh divided by 128.1 hours = 7.25 kW, approximately 7 kW
Solar System Cost
7kW multiplied by $3.01/watt (average installation cost) = $ 21,000
Solar rebates for Canada vary per area. The most common ones are the $5,000-$5,600 rebate from the Canada Greener Homes Grant.
After incentives, your total solar system cost is $16,000
Electricity cost saved
According to PV Watts, a 7kW solar system will produce about 7,624 kWh a year. The average residential price of electricity in Canada is $0.179 per kWh. Multiply 7,624 kWh per year by $0.179 gives you $1,365 per year.
Payback Period
$21,000 divided by $1365 per year is 15.4 years. This is the payback period without solar tax credits. Using the $16,000 total costs with the solar rebate from Canada Greener Homes Grant gives you a payback period of 11.7 years.
Solar Panel Return On Investment In South Africa
Using the same process mentioned above, let’s determine the payback period of a solar system in South Africa, given their circumstances.
Average electricity consumption: 30 kWh per day multiplied by 365 days is 10,950 kWh per year. This means that the average electricity usage per month in South African households is about 912.5 kWh.
Peak Sun Hours: The peak sun hours in South Africa range between 4.1-6.3 hours. This averages to about 5 hours daily multiplied by 30.5 days in a month. This will result in 152.5 hours monthly.
- Solar System Size 912.5 kWh divided by 152.5 hours = 5.9836 kW, approximately 6 kW
Solar System Cost
6kW multiplied by R23.77/watt ($1.6 equivalent as of October 2021) = R 142,620
Solar rebates in South Africa are given to those who are putting up solar water heating systems.
Electricity Cost Saved
According to PV Watts, a 6kW solar system will produce about 10,005 kWh a year. The average residential price of electricity in Cape Town is 330c per kWh. Multiply 10,005 kWh per year by 330c gives you R 33,016 per year.
Payback Period
R142,620 divided by R33,016 per year gives you a payback period of 4.3 years.
Final Thoughts
Knowing how long it takes for solar panels to pay for themselves can be summed up into the following steps:
- Know your monthly and annual electricity consumption (kWh)
- Know the peak sun hours in your area (hours)
- Calculating your specific solar system size (kW)
- Knowing the total installed cost of the solar system less solar incentives ($)
- Knowing how much energy the solar system produces annually. This is your total electricity saved per year (kWh)
- Quantifying your annual savings ($/year)
- Dividing your total cost by your annual savings to get the payback period (years)
As some of you may have noticed in the sample computations, the length of the payback period relies on the amount of sunlight in the area, solar rebates, the cost of installing solar per watt, and the average household consumption.