The 10 best wind turbine manufacturers have paved the path for other manufacturers to follow. They’ve achieved impressive results over the last couple of years and are only improving.
In the United States of America, wind power has grown steadily over the last 30 years. Today, the US generates 380 million MWh from wind power, a massive increase from 6 million MWh in 2000. That accounts for 9.2% of the US’s utility power generation.
However, from a global perspective, the bulk of wind energy is generated in the Asia Pacific region. This power accounts for 65% of the market.
At this point, you may be wondering why it’s essential to know who the best manufacturers are. The answer to your question is that the wind turbine industry is a race we need to keep an eye on.
This is because wind turbines offset the amount of Carbon Dioxide emissions drastically, and the leading manufacturers influence this. With the growth of the wind turbine industry, manufacturers have managed to avoid 1.2 billion tonnes of Carbon Dioxide.
In fact, it’s a race between time and the manufacturers to reach the 1.5 degrees goal at the end of the decade.
Fortunately, manufacturers are making leaps and bounds in onshore and offshore power generation. Let’s look at who’s leading the pack and how much of an impact they’re creating.
Table of Contents
What Are The 10 Best Wind Turbine Manufacturers?
We’ve used multiple factors to determine the top 10 wind turbine manufacturers. These factors clearly show which company is in the lead and is rising through the ranks.
We’ll take a closer look at these factors later. But, first, let’s look at two incredible feats that wind turbine manufacturers have achieved over the last year.
- The total global power generated by wind power is 837 Gigawatts! To put that into perspective, that’s enough power to supply South America with electricity for a year.
- The amount of offshore energy has tripled from 2020. This breaks all previous records and has a cumulative output of 21.1 GW.
Top 10 Wind Turbine Manufacturers
Here’s the list of the top 10 manufacturers and what percentage they contribute to the total of 98,674 MW in 2020.
- Vestas – 16%
- Goldwind – 13.8%
- GE Renewable Energy – 12.5%
- Envision – 9.4%
- Siemens Gamesa – 8.8%
- Mingyang – 5.6%
- Nordex Aciona – 5.5%
- Sewind – 4.7%
- Windey – 3.7%
- CRRC – 3.6%
These values are taken from the Global Wind Energy Council (GWEC) Supplier Side report.
The GWEC is an international trade association that works closely with manufacturers. They provide authoritative annual reports and are backed with analysis and research summaries.
In addition to their Supplier Side report, they release an annual Wind Report which summarises the industry’s advances over the previous year.
Now that we’ve determined who the top 10 manufacturers are, let’s look at the company information.
Wind Turbine Manufacturer Info
Vestas
- Company Headquarters: Aarhus N, Aarhus, Denmark
- Year Founded: 1945 (77 years)
- CEO: Henrik Andersen
- Revenue: $13 billion (2019)
- Cumulative MW: 133,930
Goldwind
- Company Headquarters: Beijing, China
- Year Founded: 1998 (24 years)
- CEO: Wu Gang (Founder)
- Revenue: $3.8 Billion (2016)
- Cumulative MW: 72,498
GE Renewable Energy
- Company Headquarters: Paris, France
- Year Founded: 2015 (7 years)
- CEO: Jérôme Pécresse
- Revenue: $15,7 Billion (2020)
- Cumulative MW: 89,159
Envision
- Company Headquarters: Shanghai, China
- Year Founded: 2007 (15 years)
- CEO: Lei Zhang
- Revenue: $41.4 Billion (2021)
- Cumulative MW: 31,035
Siemens Gamesa
- Company Headquarters: Zamudio, Spain
- Year Founded: 1976 (46 years)
- CEO: Andreas Nauen
- Revenue: $1.9 Billion (2021)
- Cumulative MW: 109,062
Mingyang
- Company Headquarters: Zhongshan, China
- Year Founded: 2006 (16 years)
- CEO: Zhang Chuawei
- Revenue: $1.3 Billion (2021)
- Cumulative MW: 26,340
Nordex Aciona
- Company Headquarters: Rostock, Germany
- Year Founded: 1985 (37 years)
- CEO: José Luis Blanco
- Revenue: $4.05 Billion (2017)
- Cumulative MW: 35,537
Sewind
- Company Headquarters: Shanghai, China
- Year Founded: 2004 (18 years)
- CEO: Liu Ping (Director & President)
- Revenue: $5.77 Billion (2021)
- Cumulative MW: 17,127
Windey

- Company Headquarters: Hangzhou, China
- Year Founded: 2001 (21 years)
- CEO: Zhen Yu Yang (Chairman)
- Revenue: $1.11 Billion (2021)
- Cumulative MW: 12,550 (2019)
CRRC
- Company Headquarters: Beijing, China
- Year Founded: 2015 (7 years)
- CEO: Wang Zhaofu
- Revenue: $32.72 Billion (2018)
- Cumulative MW: 4422
How We Chose The Best Wind Turbine Manufacturers
A manufacturer’s financial status and stability aren’t the only aspects you need to look at to determine the best.
Megawatts produced, turbines installed, markets reached, and onshore/offshore wind are all just as important.
As such, we’ve chosen the 10 best wind turbine manufacturers based on the following factors:
- Megawatts Produced
- Megawatt Increase
- Accumulative MW
- Turbines Installed
- Global Markets Reached
- Onshore Megawatts Produced
- Offshore Megawatts Produced
MW Produced by Wind Turbine Manufacturers
Unsurprisingly, the amount of power a turbine can produce is a heavy influencer on the manufacturer’s status.
The power generated from a wind turbine is measured in Megawatts (MW). The total MW produced in a year is an accumulation of efficiency and units installed.
The total amount of Megawatts produced in 2019 was 98,674 MW, and in 2021 it was 837,000 MW.
Increase From Previous Year
As much as the total MW produced is influential, so is company growth. Putting the MG produced for one year up against its previous year is a precise measurement of change.
The results indicate which manufacturers are growing at the fastest rate. For example, manufacturer CRRC has grown by 284% MW. Considering that the company wasn’t even on the top 10 list the previous year, this is outstanding growth.
The growth of a company can be measured in both percentage and MW. In our examples, we’ve used a percentage increase.
Accumulative MW
Another way to measure a manufacturer’s growth is by taking note of its accumulative MW. The accumulative MW is the total amount of MW the manufacturer has generated over its lifespan.
For example, GE Renewable energy has been around for 7 years and has an accumulative MW of 89,159. That’s an average of 12,737 MW per year.
Now, if you compare GE’s Renewable energy to Vestas, you’ll see that GE has a greater growth rate. This is because Vestas has an accumulative MW of 133,930 but has been around for 77 years. So that’s an average of 1,739 MW per year.
Turbines Installed
Another way to measure the performance of a wind turbine manufacturer is by how many turbines they install annually. This directly correlates with their annual MW output and their presence in different markets.
If a manufacturer is installing more turbines than the previous year, it shows that the company is thriving.
For reference, here’s a graph showing how many installations the best wind turbine manufacturers had in 2020:
Markets Reached by Wind Turbine Manufacturers
Good wind turbine manufacturers have a broad global reach. Markets reached refers to how many countries the manufacturer supplies turbines to. This is an excellent indication of the company’s influence on the wind turbine industry.
Different countries have unique wind profiles. Therefore, having turbines in various countries offers a more exhaustive MW generation range.
However, while this is the standard, there are some outliers. For example, if a manufacturer acts strategically, they can target countries with excellent wind profiles. This boosts their MW generation and puts them higher on the list.
Proof of this is that Vestas has a reach of 32 different markets, allowing for an expanded generation range. On the other hand, Goldwind, the 2nd largest MW generator, only supplies 8 countries.
Onshore MW
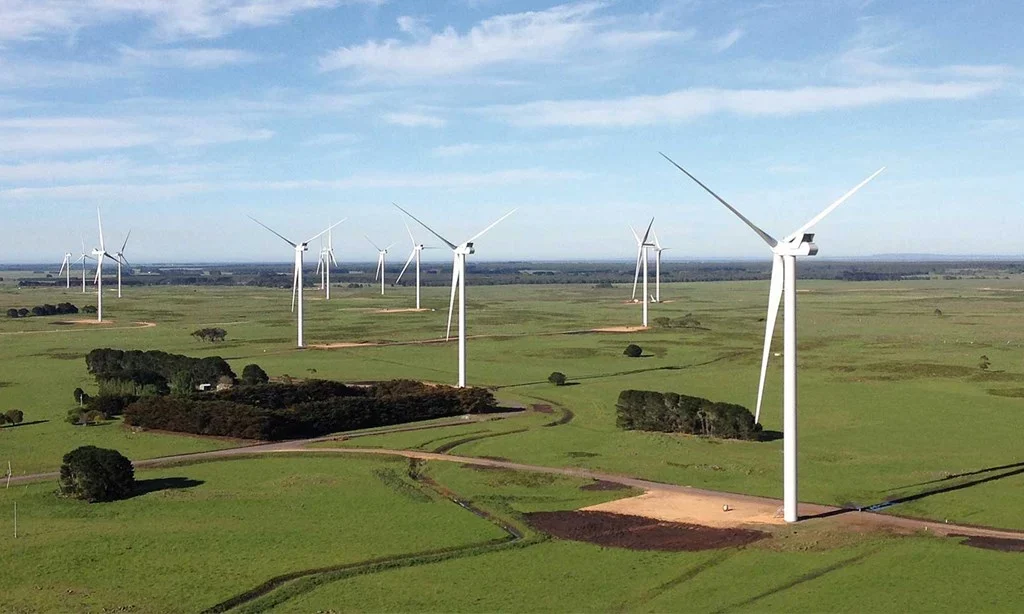
Source: Mammoet
There are two different types of turbine farms: onshore and offshore. While onshore requires open planes and large spaces, offshore benefits from ocean winds.
Manufacturers that take advantage of both of these have an advantage over those that don’t.
At the moment, onshore turbines produce the most Megawatts.
Off Shore MW
While the offshore market is smaller than onshore power, it has potential and is growing. The biggest drawback with offshore wind is the cost of installing new turbines. However, manufacturers that take the leap are reaping the benefits.
In 2021, 80% of offshore power was generated by Chinese manufacturers. China’s total cumulative MW generated is 27.7 GW.
The largest offshore manufacturer is Siemens Gamesa, with an output of 1534.75 MW. They are followed closely by Sewind, which generates 1,401.15 MW of power.
Wind Turbine Manufacturer Stats
You should now have a better understanding of how we ranked the best manufacturers. We’ve looked at which essential factors have influenced the manufacturers’ rankings.
Next, let’s take a closer look at how the 10 best wind turbine manufacturers stack up against one another:
| Manufacturer | MW Output | Increase (%) | Accumulitive | Turbines Installed | Onshore MW | Off Shore MW |
|---|---|---|---|---|---|---|
| Vestas | 15,761.00 | 38.49 | 133,930.00 | 4835 | 14,782.00 | 976.25 |
| Goldwing | 13,620.00 | 63.87 | 72,498.00 | 5362 | 13,308.00 | 312.82 |
| GE Renewable Energy | 12,345.00 | 68.51 | 89,159.00 | 4419 | 12,349.00 | N/A |
| Envision | 9,314.00 | 72.32 | 31,035.00 | 3325 | 8,635.00 | 685.59 |
| Siemens Gamesa | 8,721.00 | -11.98 | 109,062.00 | 2430 | 7,185.00 | 1,534.75 |
| Mingyang | 5,509.00 | 52.56 | 26,340.00 | 1635 | 4,543.00 | 963.21 |
| Nordex Aciona | 5,463.00 | 48.66 | 35,537.00 | 1492 | 5,465.00 | N/A |
| Sewind | 4,607.00 | 266.50 | 17,127.00 | 1563 | 3,207.00 | 1,401.15 |
| Windey | 3,658.00 | 128.77 | 12,550.00 | 1463 | 3,659.00 | N/A |
| CRR | 3,508.00 | 250.00 | 4,422.75 | 1344 | 3,511.00 | N/A |
Final Thoughts
The wind turbine market is impressive, especially if you like seeing the graphs and figures as much as we do. Watching each company’s growth is satisfying, and we can only hope that they hit the goal by 2030.
It’s also interesting to see how different factors influence the manufacturer’s ranking. For example, while MW generated is the heavily weighted factor, percentage increases and installations are also influential.
We hope this article answers all your questions – if not, you can always join our online community to get in touch with one of our experts.